::April 2018::
Winner of First Prize at ANSYS Discovery Live Competition
Choosing the optimal stent - numerical
strategies
Introduction
Clinical studies have identified factors
such as the stent design and the deployment technique that
are one cause for the success or failure of angioplasty treatments.
In addition, the success rate may also depend on the stenosis
type. Hence, for a particular stenotic artery, the optimal
intervention can only be identified by studying the influence
of factors such as stent type, strut thickness, geometry of
the stent cell, and stent-artery radial mismatch with the
wall. We propose a methodology that allows a set of stent
parameters to be varied, with the aim of evaluating the difference
in the mechanical environment within the wall before and after
stenting. Novel scalar quantities attempt to characterize
the wall changes in form of the contact pressure caused by
the stent struts, and the stresses within the individual components
of the wall caused by the stent. These quantities are derived
numerically and serve as indicators, which allow the determination
of the optimal size and type of the stent for each individual
stenosis. In addition, the luminal change due to angioplasty
may be computed as well. The methodology is demonstrated by
using a full three-dimensional geometrical model of a postmortem
specimen of a human iliac artery with a stenosis using imaging
data. To describe the material behavior of the artery, we
considered mechanical data of eight different vascular tissues,
which formed the stenosis. The constitutive models for the
tissue components capture the typical anisotropic, nonlinear
and dissipative characteristics under supra-physiological
loading conditions. Three-dimensional stent models were parameterized
in order to fit into the numerical device-optimization process.
For the three-dimensional stent-artery interaction we use
a contact algorithm based on smooth contact surfaces of at
least C1-continuity, which prevents numerical problems
known from standard facet-based contact algorithms. The proposed
methodology has the potential to provide a scientific basis
for optimizing treatment procedures and stent geometries and
materials, to help stent designers examine new stent designs
‘virtually’, and to assist clinicians in choosing
the most suitable stent for a particular stenosis.
Arterial model
An external iliac artery (female, 65 year
old) was harvested during autopsy within 24 hours from death.
The investigated artery has an atherosclerotic lesion of type
V, according to Stary et al., which contains mainly reparative
smooth muscle cells and fibrous tissue and additionally two
or more lipid pools of unequal size separated from each other
by cells and fibrous tissue. Two cross-sectional macroscopic
views of the stenotic iliac artery are provided in Fig. 1,
Sections A-A and C-C. The axial in situ pre-stretch, defined
as the ratio of in situ length to ex situ length, was calculated
to be 1.052. Use of autopsy material from human subjects was
approved by the Ethics Committee, Medical University Graz,
Austria.
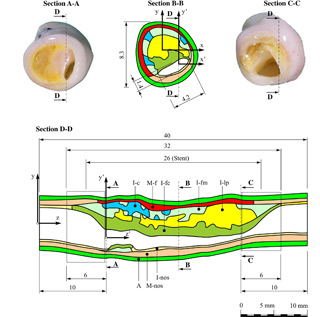
Fig. 1: Sections of the analyzed
external iliac artery. Section B-B is the region with
the smallest lumen diameter. The tissue components are:
adventitia (A), non-diseased media (M-nos), non-diseased
intima (I-nos), fibrous cap (I-fc), lipid pool (I-lp),
calcification (I-c), fibrotic intima at the medial border
(I-fm) and diseased media (M-f). The regions for the analysis
of edge effects, are denoted by the areas with dotted
frames (Section D-D).
In order to detect the three-dimensional
geometry for reconstruction purposes, we use hrMRI. For this
lesion eight different tissue types were considered: the non-diseased
intima I-nos, fibrous cap I-fc (fibrotic part at the luminal
border), fibrotic intima at the medial border I-fm, calcification
I-c, lipid pool I-lp, non-diseased media M-nos, diseased fibrotic
media M-f and adventitia A. This classification has resulted
in a separation of the diseased vessel wall (compare with
Fig. 1) that is (solid) mechanically representative and that
covers the gross histological composition of the stenosis.
This separation is also physically feasible using surgical
instruments.
For each scanned image-based cross-section the borders of
the arterial components were traced automatically by a set
of points. These points were then fitted by NURBS curves using
a least-square fitting procedure. Finally, the curves were
combined along the arterial axis in order to get the boundary
surfaces of the different tissue components. NURBS representations
have the advantage that they enable discretizations of different
mesh densities to be based on a single smooth surfaces. They
provide a suitable basis for mesh adaption procedures that
allow mesh refinement with respect to the (original) reference
geometry, and for error estimation.
Stent parameterization
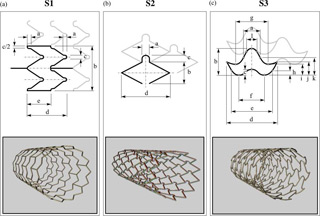
Fig. 2 : Three different stent
geometries described by a number of (geometrical) parameters,
denoted by lower case letters (upper panels). The cell
types are based on products that are (or were) available
commercially: (a) Multi-Link Tetra™ stent (Guidant):
S1, (b) NIROYAL™-Elite stent (Boston-Scientific):
S2, (c) InFlow-Gold-Flex™ stent (InFlow Dynamics):
S3. The lower panels show the generated 3D views of
the different stents.
Parametric design is a useful technique
in engineering practice when products are tailored to fit
specific customer needs or when numerical optimization is
used to generate the optimal design of a product. Both requirements
are to be addressed for the design of novel stents regarding
their geometric structure. Basically, the parameterization
of a stent involves the geometry of the stent cells, the
geometry of the stent struts, which may vary across the
stent length, and the nominal stent diameter and the length.
Local changes in the geometries of the stent cells and struts
are useful, for example, to specify different stiffnesses
at the ends of a stent in order to avoid edge effects.
In this study we investigate three different types of stent
cells, which are based on products that are (or were) available
commercially. In particular, for our study we employ shapes
of stent cells used in products such as (a) the Multi-Link-Tetra™
stent (Guidant), (b) the NIROYAL™ Elite stent (Boston-Scientific)
and (c) the InFlow™-Gold-Flex stent (InFlow Dynamics).
For subsequent use we will refer to these stent types as
S1, S2 and S3, respectively. The geometries of the stent
cells were traced from photographs.
We developed a software, which is able
to parameterize (i) the geometry of the stent cells, (ii)
the geometry of the struts (with width, measured in the
circumferential direction, and with thickness, measured
in the radial direction), and (iii) the overall dimensions
of the stent (i.e. nominal diameter, number of cells in
the axial direction and in the circumferential direction
refers to the stent diameter achieved at any axial position,
while the balloon is fully inflated). For the parameterization
of the stent cell the software requires information about:
(i) the cell type (S1, S2, S3), (ii) the geometrical quantities
to be parameterized (see the upper panels of Fig. 2; each
dimension, denoted by lower case letters, represents a parameter),
and (iii) a set of rules describing how the parameters depend
on each other.The lower panels of Fig. 2 show the generated
3D views of the different stents. The software also allows
to generate a finite element mesh for the individual parameterized
stent.
Results
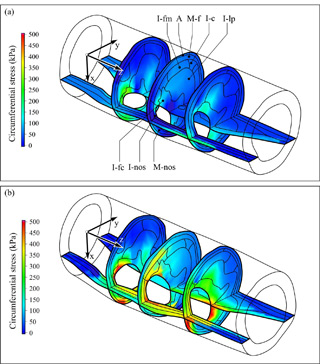
Fig. 3 : Circumferential Cauchy
stress distributions in the arterial wall before (a),
and after stenting for stent S1 at (b). The only load
applied in both configurations is the mean arterial
pressure of 100 mmHg.
We study the effect of different stent
geometries S1, S2, S3 on the stenotic iliac artery.
As a representative example, Fig. 3 shows the numerical
results in form of circumferential Cauchy stress distributions.
The cutting planes indicate stresses before (see Fig. 3(a))
and after stenting (see Fig. 3(b)) at locations, where changes
in stress due to stenting are most pronounced. For the image
shown in Fig. 3(b) the stent S1 was used. As can be seen,
stenting induces large stress concentrations in the non-diseased
area, while the diseased area remains largely unchanged.
Within the diseased part, the fibrous cap (I-fc) becomes
extensively stressed. High stress in this plaque component
may lead to tissue failure and to an increased risk of thrombus
formation.
Numerical indicators. In the following we characterize the
mechanical effect after deployment and expansion of the
stent by the numerical indicators D1 and D2.
Thereby D1 quantifies the pressure between stent
and arterial wall, D2 quantifies the overall
circumferential stress in the arterial wall. Both quantities
can be linked to adverse effects such as restenosis (i.e.
large values of D1 and D2 lead to
higher risk of restenosis). As a purely geometric quantity
of stenting success, we introduce LG, which describes the
lumen gain due to stenting. The study is based on a variation
of (i) the strut thicknesses for the entire stent, (ii)
the strut thicknesses for the end cells of the stent only,
and (iii) of the stent cell geometry. These parameter studies
are performed for four different values of mismatch DM between
stent and lumen diameter. The smallest value is such that
the diameter of the expanded stent is smaller than the lumen
diameter of the healthy arterial region, while for the largest
value of mismatch DM, the expanded stent diameter is larger
than the healthy lumen, and hence over-stretches the artery
significantly.
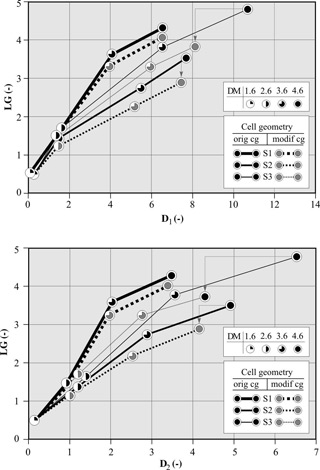
Fig. 4 : Influence of mismatch
and the modified geometries of stents S1, S2, S3 on the
three indicators D1, D2, LG . Solid
lines indicate the ‘original cell geometry’
(orig cg). Dashed lines indicate the results by modifying
the cell geometry (modif cg) (the original width of all
stent cells is increased by 30%). For each stent type,
arrows indicate the change from ‘orig cg’
to ‘modif cg’-data.
A large number of studies is possible based on the previous
concept. Here we only show how the three stents performed in the described
artery (solid lines in Fig. 4). Clearly, stent S3 (thinnest solid line)
leads to the largest values of D1 and D2 for the
present stenosis and hence shows a higher risk of restenosis than S1 and
S2.
As an additional study shown here, we increase the cell length
of the stents by 30% and analyze their performance again (dashed
lines in Fig. 4). Clearly, S3 (thinnest solid line) can be
improved most significantly with this modification when used
for the present artery, since D1 and D2
is reduced drastically, while the lumen gain (LG) is almost
not affected.
Conclusion
We have developed a method to evaluate
indicators for the stenting procedure, which can be linked
to the risk of restenosis. These indicators also allow a
judgement of the performance of stents used for a specific
artery. Numerical studies allow the determination of changes
of these indicators as a function of certain parameters
such as stent cell type, geometry of stent strut and stent
cell, and the mismatch between the smallest lumen diameter
in the stenosis and the expanded stent diameter, a crucial
parameter in clinical practice. The indicators are measures
for the mechanical stresses produced during the expansion,
which should be as small as possible, and for the lumen
gain, which should be as large as possible.
This
research was supported by the FWF - Austrian Science Foundation.
More information about this research project can be found
here.
Here's your opportunity to find out if Ninsight
can help you to solve your biomechanical problems.
If you have a biomechanical engineering problem and want a
quality solution complete our online
information form. We will forward this request the most
appropriate engineer who will contact you to discuss your
problem directly.